First Noise Images of a Machine
Records from Oct. 15, 1996Measurement of a Letter-Labeling Machine
Recordings: Carsten Busch and Gerd HeinzSoftware: Sabine Hoefs (born Schwanitz)
Images, movies and report: Gerd Heinz
(Many thanks to Dr. Georg Kinnemann from AEG-Postautomation Berlin for his support)
For industrial applications it is important to analyse the noise emissions of machinery in real environments. Installed normally in echoic rooms it is hard to decide, which parts of large machines or aggregates emit the strongest quantities of noise.
Dr. Kinnemann gave us the chance to record the emission of a letter-labeling machine. We find some unexpected locations of noise emissions in the acoustic images.
Images:
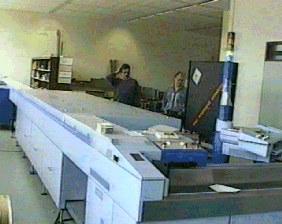
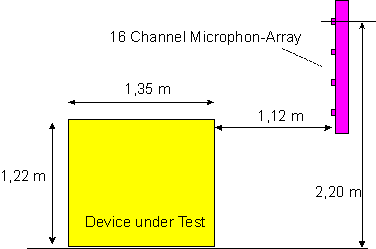
(a) Arrangement at October 15, 1996. Right in the background we see the black 16-channel microphone array, in front we see the letter labeling machine.
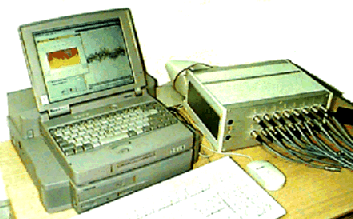
(b) Measuring workplace Toshiba-Tectra 700 with docking station for the UEIDAQ-WIN30 card and 16-channel preamplifier. Installed software: PSI-Tools.
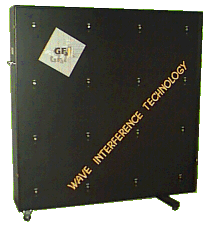
(c) 16-channel microphone array. To access defined locations for the microphones (electrostatic, MK301, Microtech Gefell) they are arranged plane to the surface with a simple orthogonal grid size of 30 cm. It is not the optimum for aliasing figures we found. To avoid reflections, the microphone membranes have been placed planar to the front of the box. The reflective construction of the box destroys the backfield waves that are smaller the box size (<1,20 m or >250 Hz).
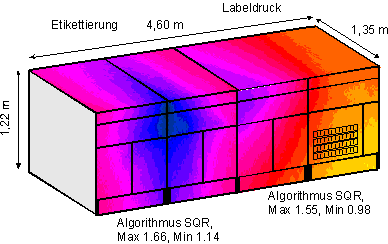
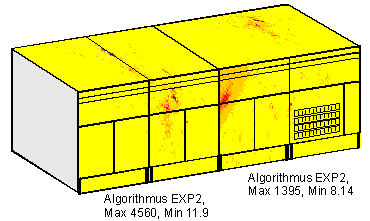
(d) Noise emission produced by a linear transfer function SQR (since 2000 we scaled on Pascal and called it "Equivalent Noise Pressure (ENP)). This function produces an average noise pressure map.
(e) Same data like (d). Peak noise emission produced by non-linear EXP-transfer function (see PSI-Tools Help) with contrast factor 2 produces an image of peak-emissions.
Excitements are related to different records and integration intervals. Left and right side had different maxima. Usually the channels were filtered with a high-pass 100 Hz/-3dB (it is not noted).
(f) Measuring arrangement. The microphone array is 4x4 orthogonal. Microphon distance is 30cm each.
Summary
With a reflective, regular 16 channel array we produced in an not un-echoic room first acoustic images and movies of a (letter labeling) machine, filtering the channels with a 100 Hz high-pass. We found differences between images of linear and non-linear transfer functions. While linear method produces an averaged image, the non-linear produces a peak-like image. It was surprising, that room resonances did not cancel the task and that the aliasing of the microphone arrangement can not be seen in the images. The reflective construction of the box destroys the backfield waves that are smaller the box size.
Records from Oct. 15, 1996
File created Jan. 21, 1997
Layout enabled for smartphones; corrections and additional comments Nov. 13, 2023
Mail to info@gheinz.de
